The [True] Great Inflation
Have you ever wondered why the inflation numbers the government reports never seem to be reflected accurately when compared to your trips to the grocery store?
Or why the unemployment metrics never seem to line up with your experience with friends and relatives who all know at least one person who is underemployed or unemployed?
Or maybe even how GDP seems to always be growing nicely, even though the economic situation around you appears to be worsening?
It’s because the numbers that the government release are incredibly easy to manipulate.
They’ve been manipulated so badly over the decades that by this point they have become complete lies.
Let’s use the Consumer Price Index (CPI) to demonstrate this. Here are the official numbers from the U.S. Bureau of Labor Statistics (BLS):
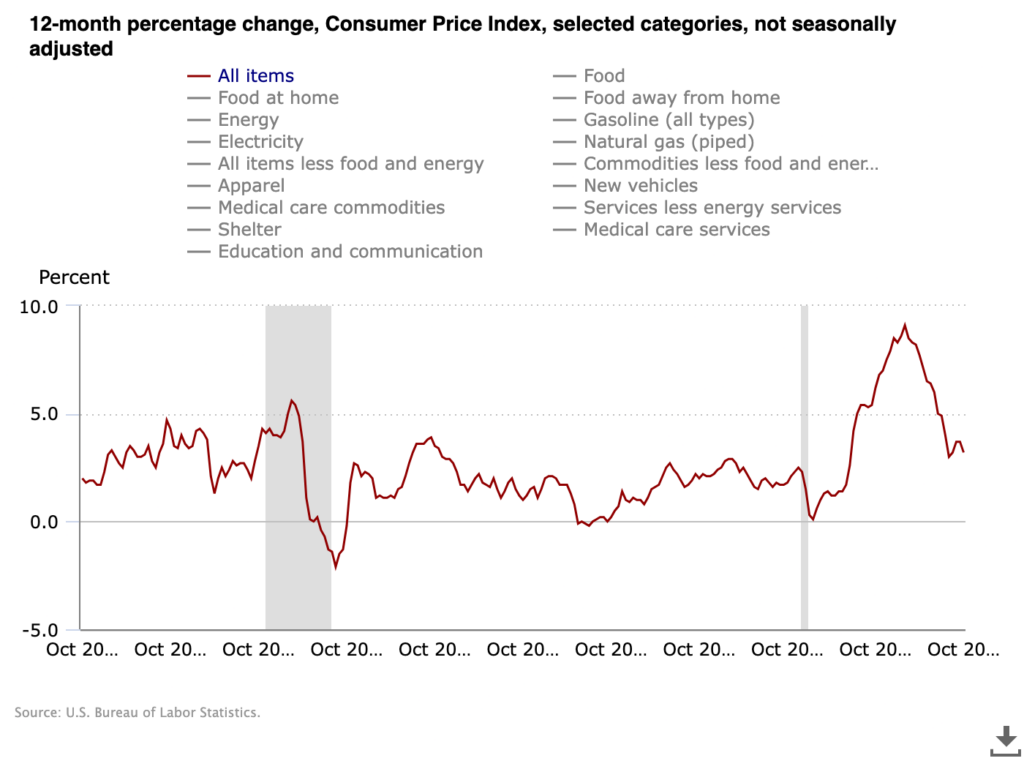
For more specific numbers, we can use the table version.
The table version for the most recent reporting period is below:
| Month | All items | Food | Food at home | Food away from home | Energy | Gasoline (all types) | Electricity | Natural gas (piped) | All items less food and energy | Commodities less food and energy commodities | Apparel | New vehicles | Medical care commodities | Services less energy services | Shelter | Medical care services | Education and communication |
| Oct-23 | 3.20% | 3.30% | 2.10% | 5.40% | -4.50% | -5.30% | 2.40% | -15.80% | 4.00% | 0.10% | 2.60% | 1.90% | 4.70% | 5.50% | 6.70% | -2.00% | 0.90% |
There is a lot here that is outright hilarious to anyone paying attention. But the 3.30% increase in food over the last twelve months is the most asinine. 2.10% increase for food at home? Yeah right. My grocery bill has increased somewhere around 50% since last year.
Oh, and everything is smaller in terms of quantity. That bag of chips has dropped quite a few ounces from pre-covid levels.
Weird. That is a mighty large ~3% for the past twelve months.
The CPI-U from FRED (Federal Reserve Economic Data) is no different. But notice the trend going back seventy years. The chart puts forward the notion that the “Great Inflation” of the 1970s is worse than now:
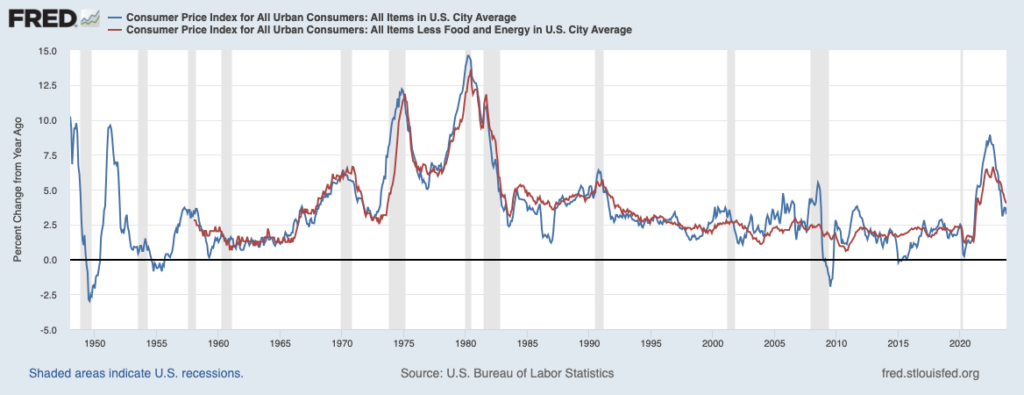
But we can tell with our own eyes (and wallets) when we go to buy anything that this is not some small level of inflation comparable to a slightly worse 2008. It is way worse.
So what is actually going on?
The government manipulates these CPI numbers. They do so through the calculations. Here are just a few examples (more methods are included in the link—I recommend giving it a full read):
- Since the 1700s, consumer inflation has been estimated by measuring price changes in a fixed-weight basket of goods, effectively measuring the cost of living of maintaining a constant standard of living.
[starting in the 1980s, it has been manipulated by]:
- Allowing substitution of lower-priced and lower-quality goods in the basket (i.e. more hamburger when steak prices rise) lowers the reported rate of inflation versus the fixed-basket measure.
- BLS introduced: Geometric weighting—a purely a mathematical gimmick that automatically reduces the weightings of goods rising in price, and vice versa—it has no demonstrated relationship to consumer substitution of goods based on price changes. It was explained as a surrogate for a substitution measure.
- BLS introduced: More frequent re-weightings of the CPI index from every ten years to every two years, which moved the CPI closer to a substitution-based index, but the change was not considered a change in methodology.
- BLS introduced: Ongoing re-weightings of sales outlets (discount/mass-merchandisers versus Main Street shops), also moving closer to a substitution-based index and creating other constant-standard-of-living issues.
The true figures are likely even worse than what Shadow Stats put out, but they at least have a better estimate:
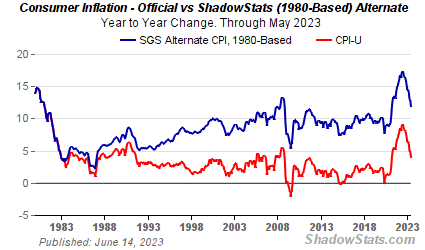
Yeah, that 3.20% official narrative doesn’t look as valid compared to ShadowStat’s ~12.5%. Anyone that has taken a grocery trip visit or had a large purchase definitely would select the much higher year-to-year change if they had to take a guess. Reality contradicts the BLS figures.
But our friendly neighborhood BLS doesn’t live in reality, so it does not apply to them.
Now, you may be wondering why this manipulation occurs. ShadowStats also explains that for us:
No. 515—PUBLIC COMMENT ON INFLATION MEASUREMENT
Consumer Price Index Has Been Reconfigured Since Early-1980s
So As to Understate Inflation versus Common Experience
- CPI no longer measures the cost of maintaining a constant standard of living.
- CPI no longer measures full inflation for out-of-pocket expenditures.
[…]
In the early-1990s, political Washington moved to change the nature of the CPI. The contention was that the CPI overstated inflation (it did not allow substitution of less-expensive hamburger for more-expensive steak). Both sides of the aisle and the financial media touted the benefits of a “more-accurate” CPI, one that would allow the substitution of goods and services.
The plan was to reduce cost of living adjustments for government payments to Social Security recipients, etc. The cuts in reported inflation were an effort to reduce the federal deficit without anyone in Congress having to do the politically impossible: to vote against Social Security. The inflation-calculation changes had the further benefit to government fiscal conditions of pushing taxpayers artificially into higher tax brackets, thus increasing tax revenues. The changes afoot were publicized, albeit under the cover of academic theories. Few in the public paid any attention.
Katharine G. Abraham, then commissioner of the Bureau of Labor Statistics, laid out her recollections in an August 1996 paper:
“Back in the early winter of 1995, Federal Reserve Board Chairman Alan Greenspan testified before the Congress that he thought the CPI substantially overstated the rate of growth in the cost of living. His testimony generated a considerable amount of discussion. Soon afterwards, Speaker of the House Newt Gingrich, at a town meeting in Kennesaw, Georgia, was asked about the CPI and responded by saying, ‘We have a handful of bureaucrats who, all professional economists agree, have an error in their calculations. If they can’t get it right in the next 30 days or so, we zero them out, we transfer the responsibility to either the Federal Reserve or the Treasury and tell them to get it right.’”
[…]
That is why you see such a large jump in 1970-1980s inflation on the official charts, but it is completely absent on the ShadowStat comparison chart. Because the accurate figures stopped being truly reported in the 1980s.
The truth is that the major inflation of the 70s-80s is comparable, if not a bit less, than what we are dealing with right now.
The government would never honestly report that, but it is the actual truth about the situation.
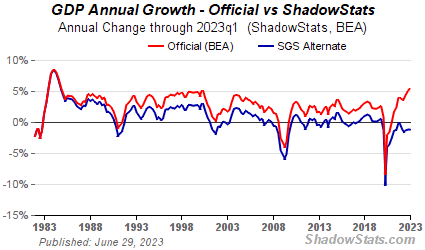
The reality is that we are currently in the Great Inflation of the 2020s. No different from the Great Inflation of the 1970s (aside from perhaps being worse). But no one is willing to admit it.
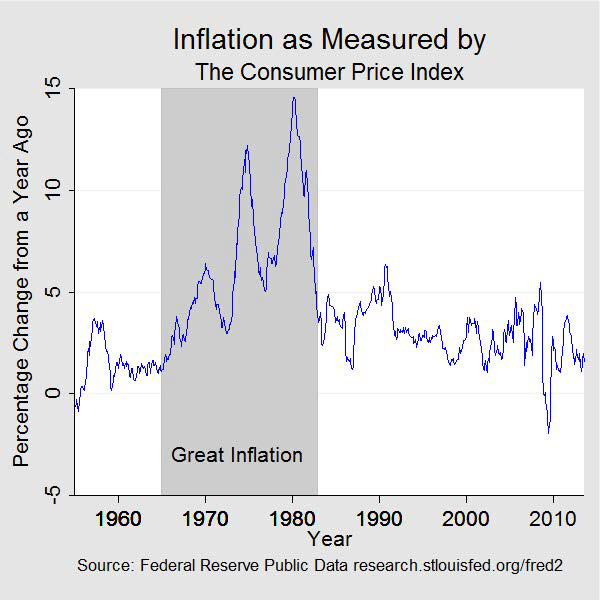
It is important to recognize that the old Great Inflation lasted well over 15 years.
We’re only three years in at this point for our term. Which means we may have a long way to go.
But one thing is certain: Inflation is already here. It is only getting worse.
The only question that remains is when we will officially recognize this period as the “Greatest Inflation”, surpassing that of our Boomer-era inflation predecessor.
Read Next: The 2023 Nobel Prize In Economics: Out Of Touch Elites
If you enjoyed this article, bookmark the website and check back often for new content. New articles most weekdays.
You can also keep up with my writing by joining my monthly newsletter.
Help fight the censorship – Share this article!


