 I write a lot about economics here and on my other social media platforms, and a common question is always “Which statistical software do you use”? It just so happens that I also recently ran across an interesting data article that compliments my answer to that question.
The only thing I use these programs for is econ (social science). So if you’re looking to do more programming-specific specialties, this article probably won’t be of much help.
There are a few obvious programs that come to mind, such as:
- SPSS
- Stata
- R
- Minitab
- SAS
- MATLAB
And a ridiculously large amount of others.
It does help to know more than one so when you’re confronted with the differing mechanisms in each, you can adapt relatively quickly. So if you’re new and trying to find one, I’d suggest broadening your horizons and trying to find two instead.
It is terrible if you’re proficient in SAS and then you go to a company/university that only has a license for Stata. Would not be a fun first few months.
R is free, so you could go download it right now and mess around in it. The other software that people usually learn is typically based on what licenses their authority has.
So let’s get straight to the point.
My two favorite: R and SPSS.
In that order.
Here’s why:
The Data
Like I mentioned above, I ran across an article by Robert Muenchen that has some exceptional graphic visualizations, listed below. The article is from R4stats.com.
Here are the breakdowns:
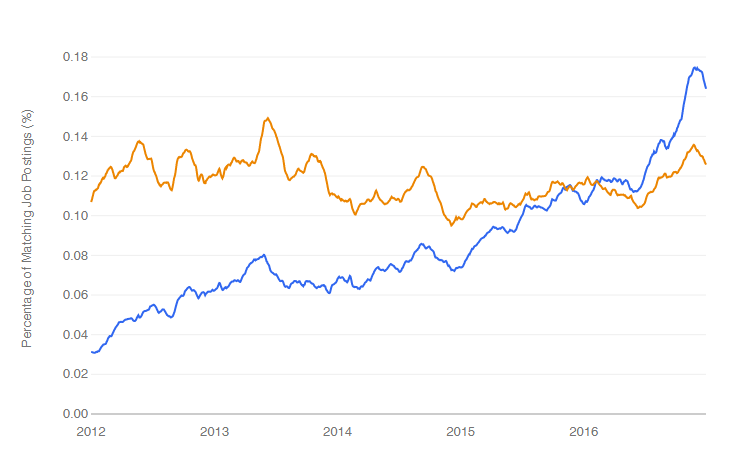
Above are data science job trends (pulled from the sources in the article) for jobs related to knowledge, in particular data science software.
The blue line is for R.
The orange line is for SAS.
As you can clearly tell, R has been on an upward trend for the job market. Not only there, but in other areas as well:
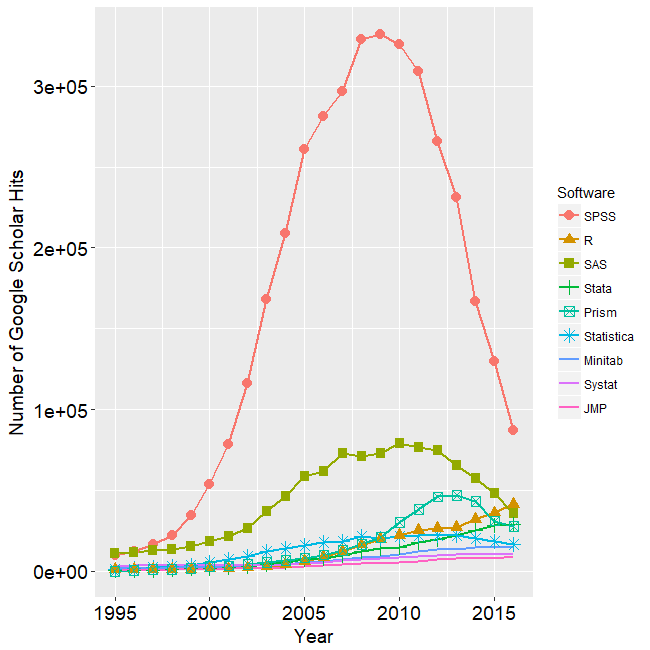
Even for Google Scholar (scholarly articles), R has been on an upward trend. While the two closest competitors, SAS and SPSS, are dropping. In the case of SPSS, quite significantly.
However, without a doubt, SPSS is still the most dominant package.
But R has a lot of advantages over it, which means it may eventually surpass SPSS in the coming years (The #1 advantage being it is free software).
Sidenote: If you’re going to give R a shot, get R studio with it, and make sure to take some time to read the manual in its entirety.
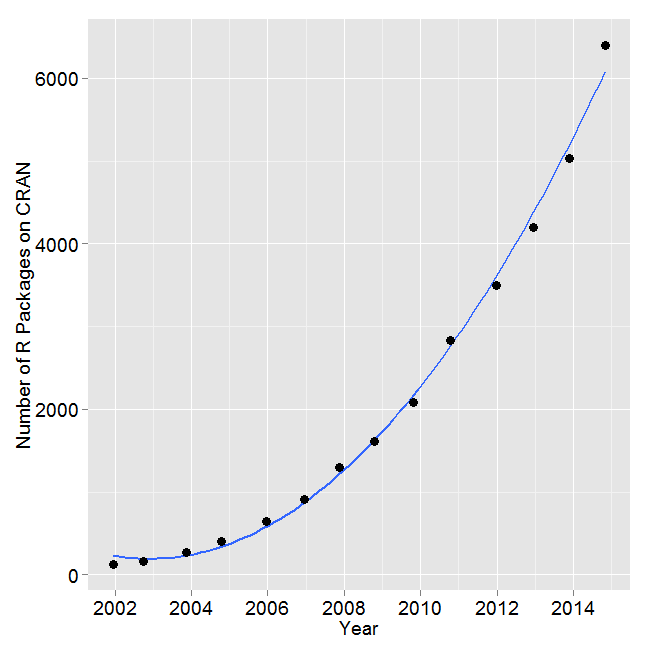
Likewise, the R CRAN has been exploding as well:
Finally, one other visual I thought was really interesting was this one:
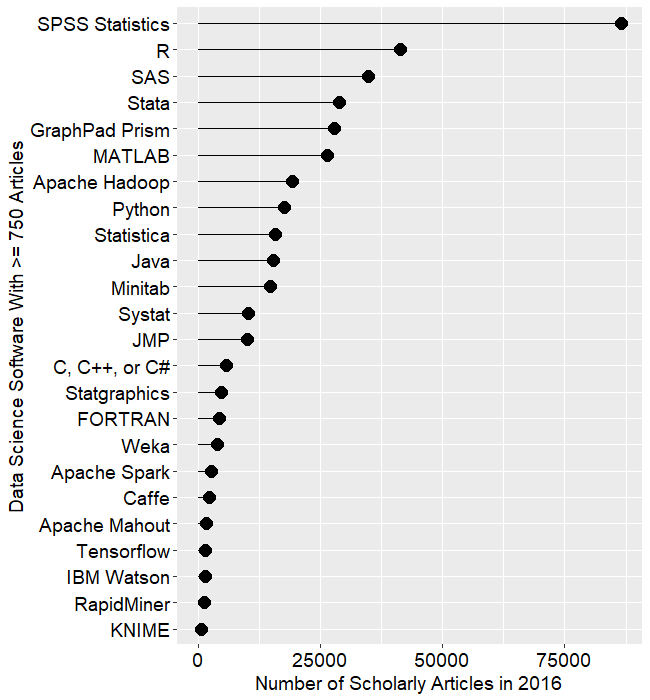
Clearly, R and SPSS have the majority of the statistical software market share.
I like SPSS for the fact that it is clearly the most intuitive for my purposes. I enjoy R because I know where ever I go, I’ll have access to it (because it’s free).
Having a combo package such as this makes it easier to jump around should you need to do so. Not every company/university will have SPSS. But by knowing SPSS, you’ll be more able to transfer to a software such as Stata or SAS more easily.
And R’s the top choice because if you absolutely can’t find a way to work something into the program you’re not familiar with, you can download a free copy of R and use that instead. R is very simple and has a massive amount of resources available to learn it. It does require more programming knowledge and familiarity with its unique idiosyncrasies, however. (= is sometimes =, sometimes <-)
Why SPSS? Well, to be honest because it was the first one I learned, so it’s an old habit. That, on top of the fact that in my science (economics) it is the clear dominant player.
So, for which software I use, the answer is R and SPSS.
Should you use them? Maybe, maybe not. I do believe that if anyone is going for the two-package approach, it should absolutely include R. Switch out SPSS with SAS or Stata, but always keep R. It’s too helpful to have around than not.